Looking for the latest sales stats and trends? We’ve got you covered.
Lead generation statistics
Discover where companies are generating their leads and how they convert them.
Budget & resources
- Lack of resources, such as staff, funding, and time, remains the biggest obstacle to successful lead generation for 61% of B2B marketers. (BrightTALK, 2015)
- 53% of marketers say half or more of their budget is allocated to lead generation, while 34% say less than half of their budget is allocated to lead generation. (BrightTALK, 2015)
- 58% of marketers say their lead generation budget will increase in the coming year. (BrightTALK, 2015)
Lead conversion
- Improving lead qualification processes is one of the top priorities for small businesses. (OnePageCRM, 2022)
- 74% of marketers say converting leads is their top priority. (HubSpot, 2016)
- For B2B marketers, the ideal number of fields on web registration and download forms is between three and five for 79% of respondents, while only 16% said it was six or more. (BrightTALK, 2015)
- 59% of marketers say they provide salespeople with their best quality leads, while salespeople rank marketing-sourced leads last. (HubSpot, 2016)
- Only 5% of salespeople said leads they received from marketing were very high quality. (HubSpot, 2016)
- 65% of marketers say generating traffic and leads is their top challenge. (HubSpot, 2016)
- The less companies know about their KPIs, the less likely they are to meet their revenue goals. 74% of companies that weren’t exceeding revenue goals did not know their visitor, lead, MQL, or sales opportunities. (HubSpot, 2015)
Effectiveness
- 80% of marketers report their lead generation efforts are only slightly or somewhat effective. (BrightTALK, 2015)
- 82% of marketers with an SLA think their marketing strategy is effective. (HubSpot, 2016)
- Only 17% of marketers say outbound practices provide the highest quality leads for sales. (HubSpot, 2016)
- Only 22% of salespeople said marketing was their best source of leads (HubSpot, 2016)
Lead nurturing statistics
Your prospects are probably not ready to buy. Here’s how strategic lead nurturing can increase your sales, revenue, and profits.
Sales opportunities
- Companies that excel at lead nurturing generate 50% more sales ready leads at a 33% lower cost. (Adobe, 2022)
- Nurtured leads make 47% larger purchases. (Adobe, 2022)
- Improving communication with existing customers is one of the top priorities for small businesses. (OnePageCRM, 2022)
- Nurtured leads produce, on average, a 20% increase in sales opportunities versus non-nurtured leads. (Demand Gen Report, 2014)
- 67% of B2B marketers say they see at least a 10% increase in sales opportunities through lead nurturing, with 15% seeing opportunities increase by 30% or more. (Demand Gen Report, 2014)
- 89% of marketers use lead nurturing as part of their demand generation strategy. The remaining 11% plan to start in the next 12 months. (Demand Gen Report, 2016)
- The top 3 future priorities for lead nurturing are CRO (84% of marketers), Increase the number of opportunities entering the pipeline (82%), and create warm, sales-ready leads (74%) (Demand Gen Report, 2016)
- 79% of marketing leads never convert to sales, citing lack of nurturing for poor performance. (Adobe, 2022)
Lead segmentation & targeting
- Lead nurturing is one of the top priorities for small businesses. (OnePageCRM, 2022)
- Segment knew that they wanted to focus on the 16% of signups responsible for 86% of revenue so they used a messaging campaign to target visitors from specific domains (by IP address) that resulted in a 5X increase in chat engagement and 2x increase in conversations. (Drift)
- Higher response rates due to communications that are targeted and relevant came out as a top benefit among marketers surveyed; it was cited by 66% of marketers as a 4 or 5 — on a scale of 1 to 5. (Demand Gen Report, 2016)
- Segmenting by title or role (49%) and by industry (48%) are mainstays for roughly half of the respondents, and a sizable number are segmenting by persona (39%). (Demand Gen Report, 2016)
- The ability to segment prospects based on interests/behaviors came in as a close No. 2, with 63% of marketers giving it a 4 or 5. (Demand Gen Report, 2016)
- 40% of marketers said they are segmenting the data by response/area of interest, as part of an ABM approach. (Demand Gen Report, 2016)
Effectiveness
- Referrals (or word-of-mouth marketing) are a top lead-generation channel for small businesses around the world. (OnePageCRM, 2022)
- 42% of marketers say they’ve been practicing lead nurturing for more than 2 years. (Demand Gen Report, 2016)
- 51% said performance in 2016 was better than 2015. 44% said it has stayed the same and only 5% stated nurture programs performed worse. (Demand Gen Report, 2016)
- Increasing business with existing customers is one of the top priorities for small businesses. (OnePageCRM, 2022)
Gated content / content upgrades
- 48% of marketers selectively gate content, based on progressive profiling. Just 23% gate lead nurturing content — down from 55% in 2015. (Demand Gen Report, 2016)
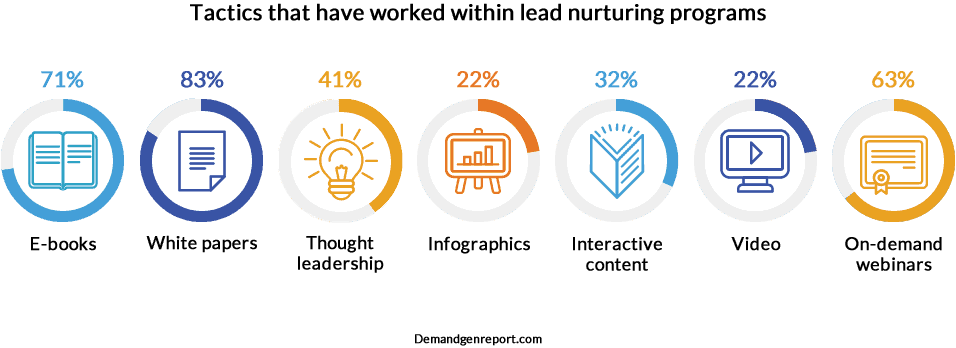
- E-books (71% of marketers), white papers (83%) and on-demand webinars (63%) are the top three types of gated content. (Demand Gen Report, 2016)
- The most effective tactics for lead nurturing are white papers (44% of marketers), email newsletters (37%), and webinars (36%). (Demand Gen Report, 2016)
Demand Generation Analytics
- 59% of marketers rely on total lead volume as a top metric. (BrightTALK, 2015)
- 28% of marketers say securing enough budget is their top marketing challenge. (HubSpot, 2016)
- 43% of marketers say proving the ROI of their marketing activities is their top marketing challenge. (HubSpot, 2016)
- Marketers that calculate ROI are 1.6 times more likely to receive higher budgets. (HubSpot, 2016)
- 42% of B2B marketing professionals state that a lack of quality data is their biggest barrier to lead generation. (BrightTALK, 2015)
- 24% of marketers don’t know whether their efforts resulted in closed-won deals. (BrightTALK, 2015)
- Inbound organizations are 4 times as likely to rate their marketing strategy as effective. (HubSpot, 2016)
- 72% of organizations that calculate ROI say their marketing strategy is effective. (HubSpot, 2016)
- Just 61% of marketers believe their marketing strategy is effective. (HubSpot, 2016)
Lead Response Times
Learn why faster is better. 93% of your competitors are probably responding too slowly to leads:
- The majority of small businesses follow up to 5 times with their prospective customers. (OnePageCRM, 2022)
- 89% of consumers we talked to would like to use messaging (primarily SMS, Facebook Messenger, and Whatsapp) to communicate with businesses. But only 48% of businesses are equipped to connect with customers through a message. (Twilio, 2016)
- 66% of messaging happens using a mobile phone and only 11% from a desktop (Twilio, 2016)
- Only 14% of companies were using live chat (Drift).
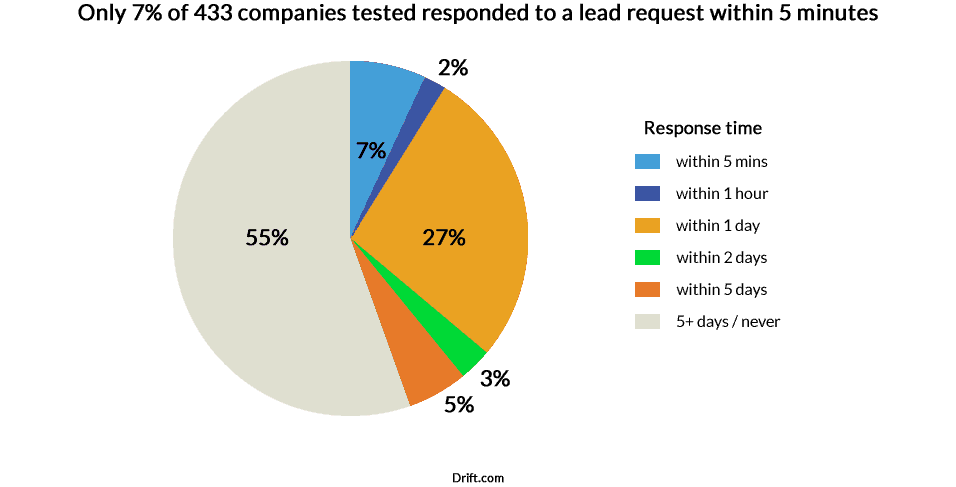
- Only 7% of 433 sales teams tested responded within 5 minutes (Drift).
- There’s a 10x drop off in lead qualification when you wait longer than 5 minutes to respond and a 400% decrease when you respond within 10 minutes compared to 5, (Insidesales)
- 55% did NOT respond within 5 business days (Drift).
- The 10 fastest companies all used live chat on their websites (Drift).
- In a study of 1.25 million sales leads across 42 companies, leads that were contacted within an hour were 7 times more likely to qualify the lead as those that tried just 1 hour later. And 60X more likely than companies that waited 24h or longer. (HBR)
- Of 2,241 US companies, only 37% had responded within an hour, and 53% within a day. 24% responded after 24h and 23% never responded at all. (HBR)
Sales software statistics
Your prospects are probably not ready to buy. Here’s how strategic lead nurturing can increase your sales, revenue, and profits.
Sales tools by category
- Scoring out of 5, the categories considered most important to sales were Customer success (4.11), Lead Gen (4.10), Lead Engagement (4.08), CRM (4.04), and Marketing Alignment (3.98). (Bowery Capital, 2017)
- Customer Success was perceived as the most important category but awareness of software solutions was just 20%, ranking 14th out of the 20 categories. (Bowery Capital, 2017)
Lead management software
- Lead Gen had the highest awareness of tools (78% awareness of the 19 tools in the category). For comparison awareness of the 16 CRM tools was 40%. (Bowery Capital, 2017)
- Lead Gen also had the highest ‘would not use’ score of 78%, 30 points higher than the next worst category, Contracts & Billing. (Bowery Capital, 2017)
- Categories with the greatest knowledge of software solutions within that category were Lead Gen (78%), CRM (40%), Lead Intel (34%), Outreach Management (33%), and Email Intel (32%). (Bowery Capital, 2017)
- Only CRM & Lead Engagement had usage levels that reflected their perceived importance. (Bowery Capital, 2017)
- The most used tools in CRM, Lead Engagement, Content Sharing, and Data Automation had usage of over 60%. (Bowery Capital, 2017)
CRM statistics
- 56% of small businesses pay attention to whether CRM offers email integration. Pipeline management is also among the top three CRM features (51%). (OnePageCRM, 2022)
- When it comes to comparing CRM systems, 86% of small businesses pay attention to their ease of use. Price and customization options are also one of the top three comparison factors (86% and 36% respectively). (OnePageCRM, 2022)
- 65% of businesses adopt a CRM within their first 5 years. (Capterra)
- The top 4 CRM solutions dominate 75% of the market. The top CRM accounts for 25% of the market. (Capterra)
- 73% of CRM solutions are web-based and 27% are on-premise/installed. (Capterra)
- The average CRM spend for businesses is $150/user. 61% spend over $50 per user per month. (Capterra)
- A study by the Gartner Group found that businesses spent nearly $20 billion on CRM in 2013. The adoption rate by end users, however, was less than 50 percent.
- A CRM can deliver an ROI of $8.71 for every dollar spent in 2014, a 56% increase from $5.60 in 2011. (Nucleus Research)
- Sales reps saw productivity increase by 26.4% upon adding mobile access to their CRM application. (Nucleus research)
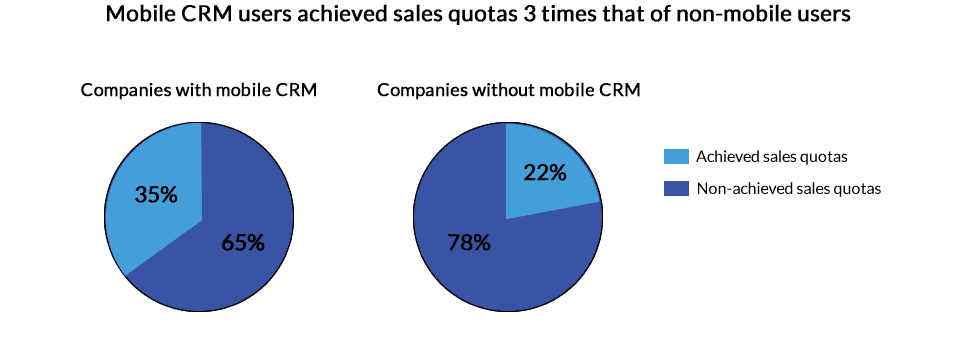
- Achieved sales quotas for mobile CRM is 3 times that of non-mobile (65% v 22%). (Satish Kumar)
- A recruitment service had an 87% increase in new hires after switching from an excel spreadsheet and a diary to a dedicated CRM. (Employability Galway)
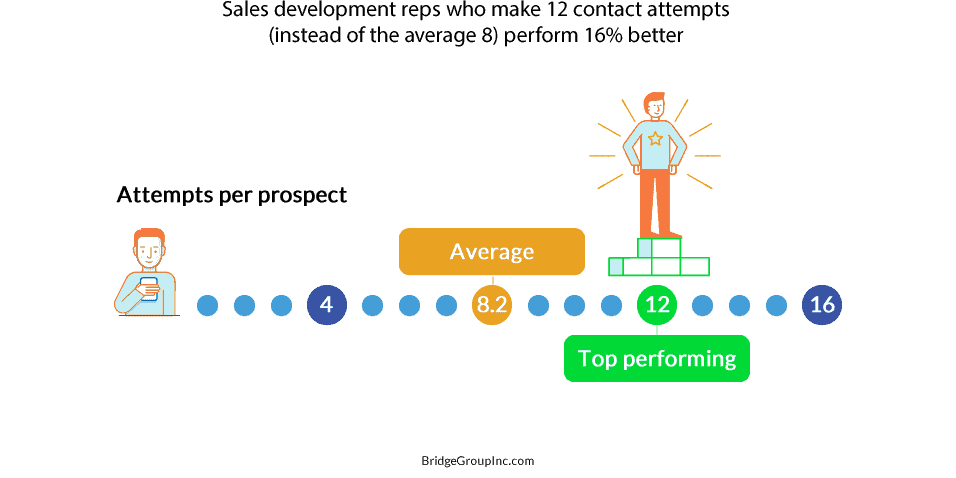
- Across 355 leading B2B sales teams sales development reps who make 12 contact attempts (instead of the average 8) perform 16% better (The Bridge Group)
- 53% of top-performing companies are investing in CRM to drive sales productivity. (Brainshark)
- CRM software had the biggest impact on customer retention rates and customer satisfaction rates, according to respondents. (Capterra)
- 47% of polled CRM users said customer satisfaction was significantly impacted by their CRM in 2015
- CRM had the most impact on customer retention (47%), customer satisfaction (47%), Revenue (45%), and upselling/cross-selling (39%). (Capterra)
- 22% of salespeople don’t know what a CRM is. (HubSpot, 2016)
- 17% of salespeople cite manual data entry as the biggest challenge using their existing CRM. (HubSpot, 2016)
- Only 21% of salespeople consider their CRM software’s integration capabilities with marketing software or other tools to be high quality. (HubSpot, 2016)
- 40% of salespeople still use informal means such as Microsoft Excel or Outlook to store its lead and customer data. (HubSpot, 2016)
- 29% of salespeople are spending an hour or more on data entry each and every day. (HubSpot, 2016)
- InsideCRM found that 55% of sales reps named ease of use as the most important feature for them.
- 85% of companies that buy CRM software to automate sales do not pick the right tools because they fail to define business objectives or develop processes for meeting objectives. (Gartner)
- 85% of companies that buy CRM software to automate sales do not pick the right tools because they fail to define business objectives or develop processes for meeting objectives. (Gartner)
- “People” issues are the biggest challenge to a successful CRM implementation. These “people” issues fall into three distinct categories: slow user adoption (49%); inadequate attention paid to change management and training (36%), and difficulties in aligning the organizational culture with new ways of working (15%). (Forrester)
- 11% of CRM users are dissatisfied. Lack of features and high price account for 73% of the dissatisfaction. (Capterra)
Sales team statistics
Learn the characteristics to look for in the most effective salespeople. And why extroverts don’t make the most sales.
Sales team management
- For companies with revenue up to $20m, a Sales Development Rep’s primary role is setting up introductory meetings. For larger companies ($20m+) the focus shifts to generating qualified opportunities. (Bridge Group, 2016)
- Companies with revenue over $20M were 3 times more likely to offer multiple career paths than smaller ones. (Bridge Group, 2016)
- SDRs contribute 65% to a company’s pipeline/revenue for small companies (<$5M) vs 40% for companies >$100M. (Bridge Group, 2016)
- SaaS companies reported that SDRs have a 23% higher contribution to company revenues than non-SaaS organizations. (Bridge Group, 2016)
- The average SDR stays for 1.4 years before moving on. Only 15% of respondents stayed beyond 2 years. (Bridge Group, 2016)
- Demand for SDRs has risen steadily since 2010, reducing the required experience 18% YoY since 2009 to 1.3 years. (Bridge Group, 2016)
- The number of companies hiring reps with less than 1-year experience grew 5-fold from 9% in 2010 to 40% in 2014. (Bridge Group, 2016)
- SDR experience rises with the company’s average sales price. Companies that require 2+ years of experience achieve a 12% higher performance than those that don’t. (Bridge Group, 2016)
- Companies with an onboard ramp of 3 months or less achieve 29% higher performance than those who onboard slowly. (Bridge Group, 2016)
- You need a clear career path to increase retention. 85% of companies offer at least 1 of step promotions, promotion across teams, and promotion into a quota-carrying role. 16% offer all 3. (Bridge Group, 2016)
Sales challenges
- The 3 most pressing challenges amongst sales leaders were training and development (27.1), leads (24.3%), and recruiting and hiring (20.5%). (Insidesales)
- 43.1% of leaders plan to add sales development and lead generation resources. 54.9% plan to maintain the same balance between field and inside resources. (Insidesales)
- The most pressing challenges amongst leaders were lead quality & quantity (46%), rules and procedures (11.5%), and training and development (8%). (Insidesales)
- Reps were twice as likely as leaders to cite lead quality and quantity as a challenge (46% v 24.3%). (Insidesales)
- B2B prospecting contact ratios are typically 10% but can increase to 55% for sales reps who try 4-6 times to contact the lead see contact ratios of 55% (Insidesales)
- 30% of marketers say having disparate data sources is the main reason they cannot glean useful insights from customers. (Cyber Sphere Security)
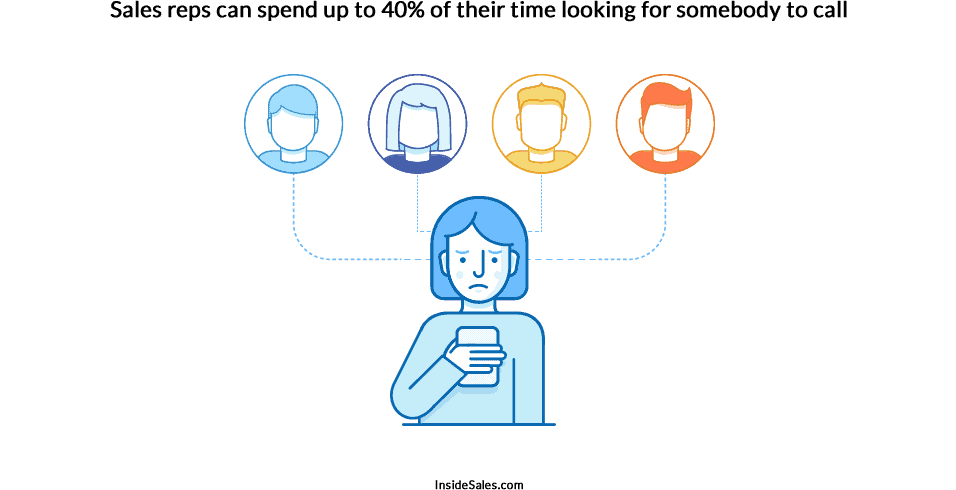
- Sales reps can spend up to 40% of their time looking for somebody to call (Insidesales)
Remote sales teams
- Call center employees who volunteered to work from home (WFH) saw a 13% performance increase after 9 months. (Stanford Business School)
- 9% was from working more minutes per shift (fewer breaks and sick days) and 4% from more calls per minute (attributed to a quieter working environment). (Stanford Business School)
- Remote workers also reported improved work satisfaction and experienced lower turnover, but their promotion rate conditional on performance fell. (Stanford Business School)
- When CTrip rolled out the option to WFH to the whole firm, over half of the experimental employees selected to switch to remote work, which led to the gains from WFH almost doubling to 22%. (Stanford Business School)
Traits of top salespeople
- Ambiverts achieve greater sales productivity than extroverts or introverts do. Because they naturally engage in a flexible pattern of talking and listening, ambiverts are likely to express sufficient assertiveness and enthusiasm to persuade and close a sale but are more inclined to listen to customers’ interests and less vulnerable to appearing too excited or overconfident. (Adam Grant, 2013)
- Over a 3-month interval, ambiverts achieved average revenues of $16,393.05, producing 24% more revenue than introverts ($13,226.60) and 32% more revenue than extroverts ($12,401.13). (Adam Grant)
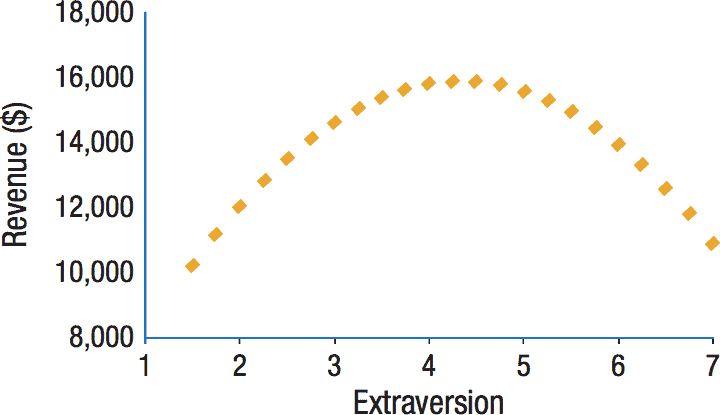
- Introverts earned an average hourly revenue of $120.10. The extroverts earned an average of $125.19 per hour. But the “ambiverts” those who scored between 3.75 and 5.50 on the personality test, blew both groups out of the water, earning an average of $154.77. And those who scored a “perfect” ambivert score of 4.0 earned an average of $208.34. (Adam Grant)
Team diversity
- Racial and gender diversity is associated with increased sales revenue, more customers, greater market share, and greater relative profits (Cedric Herring, 2009)
- Companies with racially diverse teams produced mean revenues 15X those with low diversity ($761.3m v $51.9m) and twice those with medium levels ($383.8m). (Cedric Herring, 2009)
- Companies with higher gender diversity follow the same trend for sales revenues: 14X vs homogenous companies ($644.3m v $45.2m) and 6X those with medium diversity ($299.4m). (Cedric Herring, 2009)
- Herring found that group diversity led to increased creativity, problem-solving, and performance. (Cedric Herring, 2009)
- A US retail company found that African American employees increased sales by $20 per hour in pro-diversity stores. And $26/hr for Hispanic employees. White personnel saw modest increases of $4/hr (Patrick McKay, Personnel Psychology, 2009)
- 74% of employees in companies with a high workplace diversity focus (WDF) were satisfied with their workplace, compared to 19% of employees in low-diversity companies. These diversity and satisfaction scores correlate closely with worker loyalty, engagement, productivity, and profitability. (Gallup, 2006)
Sales performance & quotas statistics
How to set realistic quotas and use intelligent compensation plans to motivate your team to reach them.
Sales performance
- Sales development reps who make 12 contact attempts (instead of the average 8) perform 16% better. (Bridge Group, 2016)
- The top 5% of performers secure 6.7 scheduled meetings per week on average. Instead of results, they focus relentlessly on the inputs they can control. (Funnel Clarity)
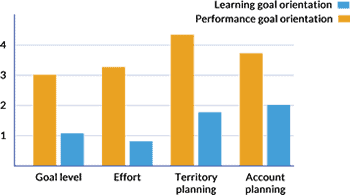
- Medical supplies distributor reps with outcome-based (external) goals performed worse than those with learning-based (internal) goals. (Insidesales)
- Those who focused on learning-oriented goals outperformed those chasing performance in 4 dimensions – they set higher goals, applied more effort, and had better territory and account planning. (Insidesales)
- 2016 quotas were 27% higher than in 2014, with a wide range of responses depending on the average sales price. ASP or $110k+ quotas as low as 3 for an outbound SDR (total revenue approx $330k) and 50 for an ASP <$5k for an inbound SDR (total revenue approx $250k). (Bridge Group, 2016)
- Setting attainable quotas to incorporate the 4 variables (activity focus, model, account size, market maturity) is difficult and only 68% of SDRs achieve quota. (Bridge Group, 2016)
- The average SDR works 265 leads per month with 64% of SDRs reporting 150-400/month. 3% of SDRs handled over 500 leads. (Bridge Group, 2016)
- This was higher (250-300) for inbound qualification teams than for outbound prospecting groups (150-200). (Bridge Group, 2016)
- Leads worked per month for an inbound SDR dropped from 325 for products with an ASP <$5k to 150 for an ASP >$250k. (Bridge Group, 2016)
Key performance indicators
The ideal salesperson understands the sales process, is flexible, knows exactly what is expected of them, is smart, and loves what they’re doing. A meta-study found positive correlations (standard coefficient) between sales performance and
- Selling-related knowledge (0.28)
- Adaptiveness (0.27)
- Work-engagement (0.23)
- Cognitive aptitude (0.23)
- Role ambiguity impacted negatively on sales performance (-0.25) (Verbeke et al, 2011)
Compensation & Bonus Structure
- Total average on-target-earnings (OTE) for an SDR were $72,100 in 2016 ($46k base salary + $26.1k bonus). This is a drop of 6.5% from 2009. (Bridge Group, 2016)
- You shouldn’t tie more than 20% of incentive comp to opportunities won for long sales. Companies that tie compensation primarily to the number of meetings perform 6% higher. Those rewarding opportunities won performed 11% worse. (Bridge Group, 2016)
- a compensation plan that included a base salary, commissions, quarterly bonuses, annual bonuses, and overachievement bonuses inspired salespeople to raise revenue by 17.9% over those who were commission-only. (Harvard Business School, 2010)
- Quarterly bonuses are more effective than annual bonuses. “Frequent quarterly bonuses tied to high demand end-of-quarter months, serve as pacers to keep the sales force on track to achieve their annual sales quotas”. (Harvard Business School, 2010)
- Reps setting appointments earn less than those generating qualified opportunities. (Bridge Group, 2016)
Closing sales statistics
Find the goldilocks moment of when to close the sale.
Sales process
- 70% of companies say closing more deals is their top sales priority. (HubSpot, 2016)
- 43% of salespeople struggle the most with prospecting. (HubSpot, 2016)
- Prospecting is the most difficult part of the sales process for salespeople. (HubSpot, 2016)
- 63% of prospects are “somewhat” or “not at all” knowledgeable about a company before a sales rep makes the first contact. (HubSpot, 2016)
- 58% of buyers want to talk about pricing in the first sales call, while 65% of salespeople want to keep the conversation on goals. (HubSpot, 2016)
- 57% of salespeople believe buyers are less dependent on salespeople during the buying process. (HubSpot, 2016)
- Only 29% of people want to talk to a salesperson to learn more about a product, while 62% will consult a search engine. (HubSpot, 2016)
- 40% of salespeople say getting a response from prospects is getting harder. (HubSpot, 2016)
- 34% of salespeople say closing deals is getting harder. (HubSpot, 2016)
- Sales reps tend to lose more opportunities on Fridays than any other day. Tuesday is the day reps have the best rate of closing deals. Tuesday’s win rate is 14.72% higher than Friday’s. (Insidesales, 2017)
- Sales reps are extremely ineffective at closing deals on weekends. Compared to weekends, weekday win rates are 72.79% higher. (Insidesales, 2017)
- At the end of the month, reps appear to be pushing deals that are not ready. There is a 2.90x increase in the number of deals closed at the end of the month but an 11.43x increase in the number of deals lost. (Insidesales, 2017)
- Reps are less effective at closing deals at the end of the month. The win rate decreases by 51.11% at the end of the month and the deal size decreases by 34.50%. (Insidesales, 2017)
- Inappropriate end-of-month sales behaviors cost companies millions. The decrease in deal size and win rate results in an estimated $98.02 million per year in lost revenue for the average company in our data set. This number represents a potential increase of 27.21% in revenue per company if properly addressed. (Insidesales, 2017)
- The “end-of-month effect” is exaggerated at the end of the quarter. There is a 1.08x increase in the number of deals closed at the end of the quarter but a 1.77x increase in the number of deals lost when compared with other ends of the month that don’t fall at the end of a quarter. (Insidesales, 2017)
- Reps close at a more effective rate until the last week of the quarter. The win rate decreases by 12.26% at the end of the quarter compared with other ends of the month. Deal sizes grow steadily toward the end of the quarter and are at their highest in week 12 then drop 11.51% in the last week of the quarter. (Insidesales, 2017)
Time management
- Companies that make 9 or more attempts per prospect see 16% higher performance, peaking at the 9-12 range. (Bridge Group, 2016)
- Good lead lists cost 5-10% of the labor costs of SDRs and can increase results by up to 1300%, yet some SDRs can waste up to 40% of their time looking for someone to call. (Insidesales)
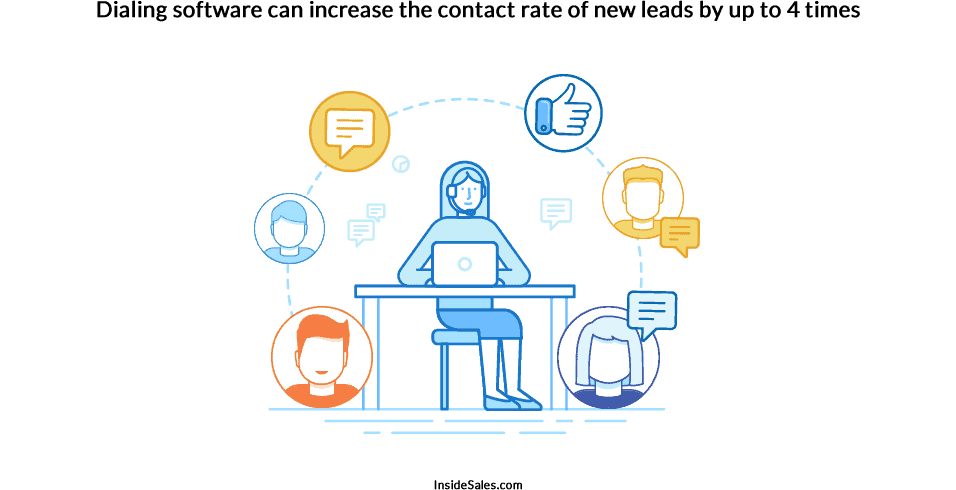
- Using dialing software can 3X to 4X contact rates of new leads by reducing the time between calls. (Insidesales)
- Often, less than 50% of leads get contacted and many reps quit after 4-5 attempts. (Insidesales)
- The average sales rep can spend 7.5 minutes making notes after each call, time that can be reduced by adding information and attachments to the database during the call. (Insidesales)
- Dialing technologies to deal with dial time, no answers, and bad numbers can take a lead generation specialist from 50 dials per day to over 170. A sales generalist can expect to go from 30 to over 70. (Insidesales)
- Up to 60% of calls can go to voicemail and callback ratios from voicemails range from 1 to 22%. Using software to leave pre-recorded messages can result in callback rates of 4.8%. (Insidesales)
- The impact of one-off seminar-style training sessions tends to drop off after 6-8 weeks, whereas sales coaching and mentoring have longer-term effects. (Insidesales)
- Having a clearly defined sales process with multiple steps can increase net sales productivity by 17%. (Insidesales)
- The average sales rep spent up to 4 hours per day sending emails, following up on calls, sending faxes, and other admin which can be reduced using templates and automation. In one case, the time to create a proposal was reduced from 45 to 2 minutes by implementing a template. (Insidesales)
- B2B contact ratios (calls:conversation) hover around 10%. Sales reps attempting to call 4-6 times have a success rate of 55%. (Insidesales)
- The chances of making successful contact with a lead are 100 times greater when a contact attempt occurs within 5 minutes versus responding 30 minutes after the lead was submitted. Similarly, the odds of the lead entering the sales process, or becoming qualified, are 21 times greater when contacted within 5 minutes versus 30 minutes. (Insidesales)
- Marginal call efficiency (calls converted per calls made) decreases after 35 calls per day but SDRs should still make those calls, focusing on the most qualified leads. (Birst, 2017)
Social selling statistics
Your customers are using social media and they need your product. Here’s what you need to know.
Social media statistics
- On average decision makers consume 5 pieces of content before being ready to speak to a sales rep. (CMO council)
- 96% of sales professionals use LinkedIn at least once a week and spend an average of six hours per week on professional networking site. (Nimble)
- 10.8% of social sellers have closed 5 or more deals attributed to social media. (A Sales Guy)
- 54% of social salespeople have tracked their social selling back to at least 1 closed deal. (A Sales Guy)
- 72.6% of salespeople using social selling as part of their sales process outperformed their sales peers and exceeded quota 23% more often. (A Sales Guy)
- 46% of social sellers hit quota compared to 38% of sales reps who don’t. (Aberdeen Group)
- 64% of teams that use social selling hit quota compared to 49% that don’t. (Aberdeen Group)
- 92% of buyers say they delete emails or voicemail messages when comes from someone that they do not know. (A Sales Guy)
- 53% of salespeople want help in understanding social selling better. (A Sales Guy)

